
Circuit Breaker

8probe sources feeding discovery
- 89.0k
- lines of JS and JSX in the frontend
- 73.8k
- lines of Python in the backend
- 12.7k
- lines of Go in the edge agent
- 45.4k
- lines of test across the monorepo
- 435
- routed endpoints, every one covered by a checked-in auth policy
- 109
- database migrations
- 11
- map layout engines, all pure functions
- 10
- entity types drawn on the graph
- 200
- stars on GitHub
- 9
- forks
- 17
- published releases since March
- MIT
- licence, checked into the repository
Circuit Breaker is a self-hosted control plane for a homelab or a small datacenter. It discovers what you run, draws it as a live topology, polls it for health, and keeps a tamper-evident record of every change. The premise is that you should not have to draw your own network diagram: devices are discovered, not declared, and the map is a live view of what is actually on the wire rather than a document that went stale the day after you drew it.
It runs on my own hardware, on the four-node Proxmox cluster, and it is in an iterative development cycle with semantic versioning so every change has provenance.
The shape of the repository#
Three deployable units live in one monorepo. The backend owns all the domain logic and is the only thing that touches the database; the frontend is a pure API consumer; the Go agent is an optional edge process that runs on machines you want first-party telemetry from.
| Path | What it is | Stack |
|---|---|---|
apps/backend |
API, workers, integrations, migrations. 57 router modules, 82 service modules, 80+ ORM models. | Python 3.12, FastAPI, SQLAlchemy 2, Alembic, Pydantic v2 |
apps/frontend |
Single-page app. 29 pages, 164 components, 27 custom hooks, half of them stream consumers. | React, Vite, React Flow, sigma and graphology, d3-force, Plotly |
apps/agent |
Edge collector: host facts, network scoping, remote probes. Ships its own updater and spool. | Go 1.25, Noise IK, gorilla/websocket, miekg/dns |
docker/, deploy/ |
Single-image runtime: supervisord units, nginx config, Postgres bootstrap, migration hooks. | Dockerfile.mono, supervisord, nginx, pgbouncer |
specs/, docs/ |
Release-gate evidence, ADRs, the security suppression ledger, the user-facing docs site. | Markdown, JSON policy files checked in CI |
Source, by language
- JS / JSXfrontend – 29 pages, 164 components, 27 hooks89.0k50.7%
- Pythonbackend – API, six workers, integrations73.8k42.1%
- Goedge agent – collector, probes, updater12.7k7.2%
GitHub’s own counter measures the same tree in bytes rather than lines, and reaches the opposite verdict about which unit dominates. Both numbers are checkable, so the page carries both:
The same source, weighed in bytes
- Pythonbackend – over half the tree by weight7.71MB60.8%
- JS / JSXfrontend – first by lines, second by bytes3.61MB28.4%
- Goedge agent – collector, probes, updater1.37MB10.8%
One rule shapes the backend more than any other: routers decode and authorize, services do the work. A route module resolves the caller, validates a schema and calls into a service; no SQL and no domain branching live in the route layer. That is what makes the same logic reusable from the six background workers, which import services directly and never call the HTTP API.
One author carries the whole tree: GitHub’s contribution graph shows 529 contributions from BlkLeg beside a single dependabot bump.
One container, one process tree#
The deployment target is somebody’s homelab, so the whole stack ships as a
single container: Postgres, NATS, Redis, the API, six workers and nginx under
one supervisor, on a read-only root filesystem with a single writable /data
volume. The API binds to loopback only. Nginx is the one process listening on
a public port.
Fig 1 – one image, one process tree
Public edge
- nginxTLS, static SPA, per-stream proxy locations
Application
- FastAPI, uvicorntwo workers, loopback only
- six workersdiscovery, notification, telemetry, monitor-scheduler, monitor-poll, probe-dispatch
Bus
- NATS with JetStreamdurable queues, at-least-once
State
- PostgreSQL 15TimescaleDB, pgbouncer
- Rediscache, rate limits, presence
- /datathe one writable volume
Nothing but nginx is reachable from the network, and the API and the six workers never call each other directly. They meet on the bus and in the database, which is why any worker can be restarted, scaled out, or pointed at an external Postgres without the API noticing.
Bundling a database and a message bus into an application image looks lazy until you count the support burden of the alternative. Every additional service in a compose file is another thing a user has to understand before the tool works at all, and the users here are homelabbers, not platform teams. The convenience is the default, not the ceiling.
Three ways to install it#
The single image above is the Docker path’s unit of delivery. The README recommends installing natively instead – systemd, no Docker prerequisite – and ships a Proxmox script and a compose mode beside it:
curl -fsSL https://raw.githubusercontent.com/BlkLeg/CircuitBreaker/main/install.sh | sudo bash
The Proxmox path runs on the hypervisor itself: one script creates a Debian 12
LXC container, installs natively inside it and auto-configures the Proxmox API
integration, walking through setup in an interactive TUI in about three
minutes. The compose path installs Docker only if it is missing, fetches the
official compose templates into ~/.circuitbreaker, writes .env defaults
and runs docker compose up -d.
First run on the native path prints the URL of an out-of-box setup wizard, served behind a self-signed certificate until a real one is issued. The plain HTTP port (8088) stays reachable but cannot create the first account.
Note: the initial user is only ever minted over TLS. The README carries that in a parenthesis; it is the one detail most likely to cost somebody an evening.
cb, the CLI, ships with the two native installers; compose deployments
manage themselves with docker compose instead. What it runs:
| Command | What it does |
|---|---|
cb status |
Status of every Circuit Breaker service |
cb doctor |
Health checks and diagnosis |
cb logs |
Tail all service logs, live |
cb restart |
Restart all services |
cb update |
Update to the latest version |
cb backup |
Back up the database |
cb version |
Show the installed version |
cb uninstall |
Remove Circuit Breaker |
What happens to one request#
Every call from the SPA carries an HttpOnly session cookie and, on writes, a double-submit CSRF token. Starlette wraps middleware in reverse registration order, so the last one added is the first one executed – the diagram below is in execution order, which is the order that matters when you are debugging a 403.
Fig 2 – seven middleware layers, then authorization
1-7 middleware
- TenantMiddlewareresolve tenant scope
- TenantRateLimittoken bucket
- SecurityHeadersCSP, HSTS, frame-deny
- Loggingredacted at the filter
- LegacyTokendeprecated API tokens
- CSRFdouble-submit on writes
- CORSsame-origin unless configured
8 route match
- 435 endpointsevery one covered by a checked-in auth policy
9 authorization
- require_auth, require_rolerole hierarchy and scopes, session revocation check
10 service
- service moduleall domain logic, one transaction per request
11 effects
- audit_logactor, IP, diff, prev_hash
- NATS publishto live clients
- Redis countersrate limit state
Layer 8 is the interesting one. All 435 routes are enumerated into endpoint_inventory.json and diffed against endpoint_policy.json in CI: adding a route without an auth dependency fails the build unless it is explicitly listed as an allowed exception.
Discovery never writes to your inventory#
Scans fan out across whatever the deployment can reach. Results are
fingerprinted against a vendor catalog and a device knowledge base, then
written to a scan_results staging table that nothing else in the system
reads from. The catalog is a real asset – more than 70 devices across 20
vendors, Dell, HPE, Ubiquiti, Synology and APC among them – with freeform
entry for what it does not know.
Fig 3 – eight probe sources, one review gate
Probe
- nmap, masscanport sweeps
- mDNS, ARP, DHCPthe local segment, answering or not
- SNMP, LLDPneighbour tables
- Docker, Proxmox, OPNsenseAPIs that know their own contents
Collect
- discovery workerprogress published to the UI as it runs
Identify
- fingerprintOUI, vendor catalog, device knowledge base
Stage
- scan_resultsstaging only, inert, read by nothing else
Promote
- a person clicks mergeinto hardware, service and network rows
- dismissedkept as history
Everything upstream of the review gate is disposable. That is exactly what makes it safe to run an aggressive scan against a production network you care about.
The consequence is architectural, not just procedural: the discovery pipeline is append-only, so it can be re-run, dropped or rewritten without any risk to an inventory somebody has spent months curating. Every change to inventory has the same shape and leaves the same audit row, whether a human or a scheduler caused it.
Telemetry that degrades to a queue depth#
The telemetry worker polls every enabled device on its own interval. Credentials are decrypted from the vault at poll time and never held in plaintext at rest. The naive version of this writes a row per poll.
Fig 4 – poll, queue, batch, cache
Poll
- RedfishiDRAC and iLO
- SNMPUPS units and switches
- Proxmox APIhypervisors
- Fernet vaultcredentials decrypted per poll
Publish
- TELEMETRY streamtelemetry.ingest per device, durable across restarts
Ingest
- pull consumerbatches of 50 per commit, acks after the write
Store
- TimescaleDBhypertables, retained
- Redis60 second TTL, latest state
Push
- telemetry WebSockethealth rings update in place on every open map
When NATS is unavailable the collector writes straight through to the database instead of failing. The queue is an optimization the system is allowed to lose without losing monitoring.
The fallback is the part worth defending, and it is not unique to this path. Every route that uses the bus has a degraded mode that works without it.
Real-time fan-out#
Anything that changes state publishes a message; nothing polls the database to find out what happened. Subjects are namespaced and declared as constants in a single module, so the set of things the system can announce is greppable in one file. Each subject family surfaces on exactly one transport.
| Subjects | Transport | Client |
|---|---|---|
notifications.*, alert.* |
SSE /events/stream |
sseClient into an emitter |
discovery.scan.*, device.found |
WS /discovery/stream |
useDiscoveryStream |
telemetry.update, proxmox.* |
WS /telemetry/stream |
useTelemetryStream |
alert.monitor.down.{id} |
WS /monitors/stream |
useMonitorStream |
topology.node.*, cable.* |
WS /topology/stream |
useTopologyStream |
agents.event |
WS /agents/stream |
useAgentLive |
Notifications use SSE because they are one-directional and need to survive proxies; the rest use WebSockets because the client also sends viewport hints and subscription filters. Every stream re-checks its session every fifteen seconds, so revoking a session kills an open stream instead of waiting for the client to disconnect, and SSE degrades to a two-second database poll if NATS is down. Connections are capped globally and per-IP so one stuck browser tab cannot exhaust the server.
Checks run from wherever they can see#
Uptime checks are scheduled by a single clock guarded by a Postgres advisory lock: many replicas may be running, exactly one enqueues. Each tick claims due items and advances their next run time in the same statement, so all scheduling state lives in the database and a restart resumes cleanly with nothing wedged. A check only becomes an event when its status changes, so a target that flaps for an hour produces one notification rather than a thousand.
There are two work queues, deliberately. Checks the server runs itself go on one; checks executed by a remote agent go on another. An agent that stops draining backs up its own queue and nothing else. Fair sharing lives in the scheduler, where no single vantage point may take more than fifty slots of a two-hundred-item tick, so one agent with a thousand assigned checks cannot starve the rest.
The agent exists for vantage point rather than for scale. It sees what an out-of-band controller cannot: process-level host facts, the kernel neighbour table, and checks run from inside a network segment the server has no route to. It dials out over WSS and authenticates with a Noise IK handshake – no session cookie and no bearer token on that path, because the handshake is the authentication and the agent’s static key is its identity from enrollment onward. It is entirely optional, and the system is fully functional without it.
Most of the engineering in the agent is failure handling, for one reason: a severed network is usually not a closed socket. Writes to a dead socket succeed is the longer account of what that costs, of the 64 MiB disk spool that catches the outage, and of the symmetric read deadline that detects it in sixty seconds instead of fifteen minutes.
The map is two graphs, not one#
Every data path above exists to put something on one screen, and the map is the component that took the most hours. Not because a graph is hard to draw, but because it has to stay correct and legible while eight independent sources mutate it underneath the cursor. Telemetry pushes a health change, a scan finishes, a monitor flips a node red, someone drags forty nodes at once, and none of that is allowed to lose an edge or throw away a layout somebody spent an afternoon arranging.
The idea that makes it tractable is that the graph and its picture are two different things, fetched separately and stored separately.
Fig 5 – three fetches, one store, two renderers
Structure, server-owned
- build_topology_graph10 entity types, 11 relation kinds, tenant-filtered, no N+1
- GET /graph/topologyETag over graph contents, 304 when nothing moved
Presentation, client-owned
- graph_layoutsone row per map, ten maps maximum
- GET /graph/layoutpositions, shapes, boundaries, routing overrides
One store
- nodes and edgesrefs mirror state so callbacks stay stable
- live overlaystatus, latency, uptime folded on by id – never reaches the layout engines
Render
- React Flowreal DOM nodes, custom cards, port handles, drag
- Sigma over WebGLthe same graph once the DOM gives up
The live-overlay row never reaches the layout engines. That is the invariant that stops a health ring from making the whole map twitch every time a device changes state.
That split is what lets everything else be simple. Deleting a service removes a node without disturbing anyone’s layout. Re-running discovery adds nodes that auto-place into free space instead of forcing a re-layout. And a layout engine can be swapped or rewritten without a migration, because no server code has an opinion about geometry.
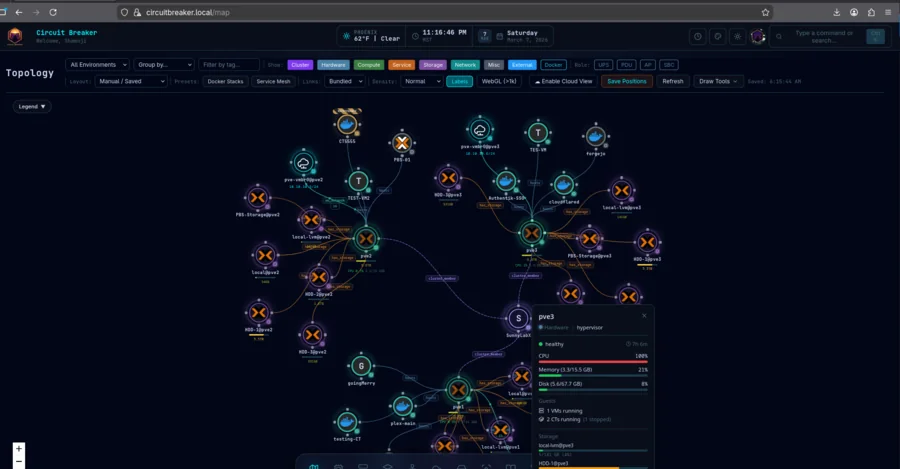
Nothing about a layout engine touches the network, so switching is instant, undoable and testable without a DOM, and adding a twelfth is one file and one entry in a list. The two renderers are chosen by scale: React Flow gives real DOM nodes – rich cards, telemetry rings, port handles, drag-to-arrange – and stops being pleasant somewhere in the hundreds, at which point Sigma over WebGL takes the same graph.
Layout is where the iteration went. A network of this size renders as an unreadable hairball under a naive force simulation, so the map offers deliberate arrangements instead. The concentric layout below pushes every node onto rings and routes the links across the middle, which trades edge clarity for a complete picture of scale.
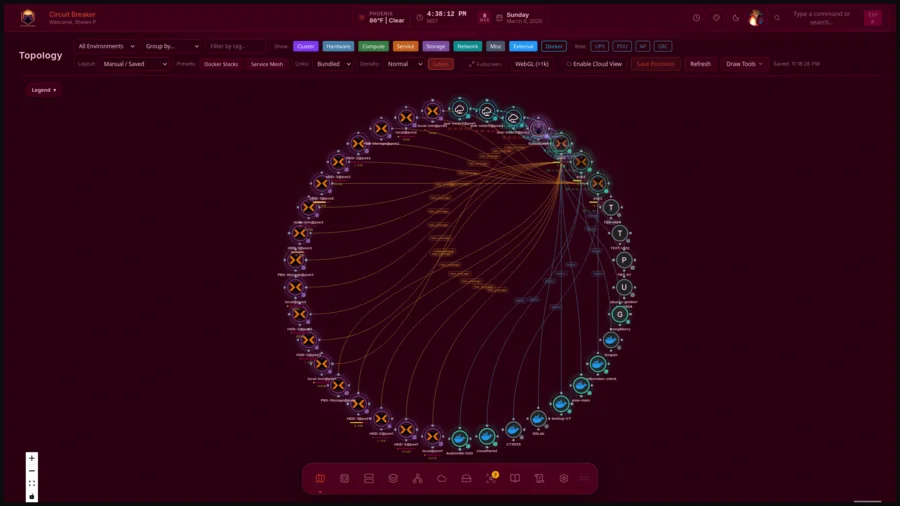
One smaller rule does a surprising amount of work: edges are derived, not
drawn. A line between two nodes means a real relation exists in the database
– hosts, runs, on_network, depends_on. Ad-hoc edges can be added, and
they render dashed and in a different colour precisely so that nobody mistakes
decoration for fact.
Ten separate hooks carry data load, layout, mutations, edge interaction, boundary interaction, visual lines, drag snapping, real-time merge, timers and tab state. Every timer lives in one of them, so unmount cleanup is a single path instead of a leak hunt.
The bug that cost the most hours on this screen was a multi-select drag that could silently drop edges. React Flow emits a batch of change events during a drag, and a race between the position update and the edge re-snap could commit a node array whose edges no longer resolved: connections vanished from the screen and, if an autosave landed first, from the database. The fix snapshots the edge id set at drag start, diffs it against every candidate commit and restores anything that went missing. Fifty lines that exist entirely to make a feature feel trustworthy.
A topology map is judged in the first three seconds – whether it looks considered or looks like a graph library’s default output. Most of the refinement went into things nobody will name: edge routing that picks handle sides by relative position, boundary shapes that sit behind nodes without eating clicks, auto-placement that finds free space instead of stacking, and a viewport fit that frames the estate rather than centring its bounding box.
Security shaped this, not the other way round#
This is infrastructure tooling holding IPMI credentials and hypervisor API keys for somebody’s entire estate. Several of the decisions above exist because of that rather than despite it.
| Control | What it does |
|---|---|
| Route policy gate | All 435 routes are diffed against a checked-in policy file in CI. A new endpoint without an auth dependency fails the build. |
| Fernet secrets vault | Credentials encrypted at rest with a key that lives outside the database. The vault refuses to generate an ephemeral key at import time, so a wrong key is a loud failure rather than silent data loss. |
| Hash-chained audit log | Each entry stores SHA-256(payload + prev_hash) under a write lock, so concurrent appends cannot fork the chain. Verification walks it and reports the first break. |
| Mid-stream revalidation | Long-lived SSE and WebSocket connections re-check session validity every fifteen seconds. Revoking a session ends the stream. |
| Least-privilege container | Read-only root filesystem, cap_drop: ALL with seven capabilities added back for named reasons, no-new-privileges, supervisor-dropped UIDs per service. |
| SSRF and egress control | Integration targets pass a URL validator and a network ACL before any request leaves the process. Outbound traffic can be pinned to a proxy, and an air-gap mode disables it entirely. |
| Authentication | bcrypt password hashing, TOTP MFA, and OAuth through GitHub and Google plus generic OIDC for Authentik, Keycloak and any other OIDC provider. Sessions are HttpOnly cookies throughout. |
| Automatic HTTPS | nginx terminates TLS: Let’s Encrypt for public domains, a local self-signed CA for LAN names. |
Five things a reviewer asks#
Why one container instead of a compose stack#
The users are homelabbers, and every additional service is a support burden. Bundling Postgres, NATS and Redis under supervisord makes the install one command and one volume, and because each is reached through a URL from config, any of them can be pointed at an external instance when someone outgrows the default.
The native systemd installer now ships beside the image and is the README’s recommended default. The argument is identical either way: one command, one volume, nothing for a homelab user to orchestrate.
Why a message bus in a single-node application#
Not for scale – for decoupling and durability. It is what lets the collector stop caring whether the database is slow, lets a worker restart mid-upgrade without losing samples, and lets six independent processes fan work out without any of them knowing the others exist. Every path that uses it also has a degraded mode that works without it.
Why the agent exists when SNMP already works#
Vantage point. An agent sees what an out-of-band controller cannot: process-level host facts, the kernel neighbour table, and checks executed from inside a network segment the server cannot route to. It is optional, and the system is fully functional without it.
What was the hardest bug#
The silent-link failure in the agent. Writes to a black-holed socket keep succeeding, so the agent believed a dead link was healthy and an entire outage’s samples went into the void instead of the spool. The fix – symmetric read deadlines on both ends, tied to a heartbeat interval both sides agree on – is three lines and a long comment explaining why they are load-bearing.
What would you change#
main.py is 2,100 lines of router registration and lifespan wiring that wants
to be a declarative router manifest. MapPage.jsx is still 3,000 lines after
ten hooks were extracted from it, and the orchestration that remains should
become a reducer. The frontend is JSX with JSDoc types rather than TypeScript,
which the stream-heavy hooks would benefit from most. And the eighty-model ORM
module should be a package split by bounded context; there is a proposal for
that in the tree already.
The loop closes#
Read the system left to right and the story is simple: the estate is polled and scanned by workers, everything they learn is announced on a bus, the API turns that into inventory and pushes live changes down open streams, and the map draws it.
Fig 6 – the whole system, one loop
01 collect
- telemetry_collectorper-device interval
- integration synccluster and VM inventory
- discovery workerscan, stage, review
- monitor schedulerto poll and to probe dispatch
02 distribute
- NATS JetStreamCB_EVENTS, TELEMETRY, MONITOR_POLL, MONITOR_PROBE
03 serve
- FastAPI435 policy-gated routes, RBAC and audit on write
- SSE and five WebSocketscapped per-IP, revalidated every 15 seconds
- PostgreSQL, TimescaleDB, audit_log, Redis, vaultthe state everything else reads
04 render
- topology map engine11 layouts, two renderers, overlays that never move geometry
- 29 other pagesdiscovery review, monitors, agents, IPAM, racks, storage, logs, audit
A scan finds a host, you merge it, a node appears on the map, you right-click and add a monitor, the scheduler enqueues it, a poll worker or an agent runs the check, and the event alerts you and repaints that same node. Every user action re-enters at 01.
Where it is going#
It is pre-1.0 and says so in its own README: not fully audited, LAN-only until
the release gates pass. The README’s notice is version-stamped – "0.4.0. Not
fully audited; several 1.0 security acceptance rows are still unevidenced" –
and names internet-exposed deployment as outside the 1.0.0 support boundary,
which is itself checked in at docs/release/1.0.0-support-contract.md. The
gates – the endpoint policy, a security suppression ledger, and evidence
files under specs/ – run in CI, which is the part that makes the claim
checkable rather than merely reassuring. The user guide lives at
blkleg.github.io/CircuitBreaker,
next to the architecture reference this page counts from.
Seventeen releases since the repository was created at the end of February say the cycle is real:
Releases shipped, by quarter
- Q1 2026the repository is three weeks old – the whole 0.1 and 0.2 line952.9%
- Q2 2026the 0.3 line, then May and June go quiet211.8%
- Q3 2026v0.3.3 and v0.3.4 in July, three 1.0.0 rcs in August, v0.4.0 on 1 September635.3%
The map is not a view bolted onto the platform. It is what the platform is for, and every data path above exists to put something on it.